Applying Services Marketing within the Equipment Dealers Business Model

Applying Services Marketing within the Equipment Dealers Business Model

Guest writer Ron Wilson offers an instructive guide in this week’s blog post: “Applying Services Marketing within the Equipment Dealers Business Model.”

Marketing plays a critical role within the equipment dealership. Two of the basic functions are to promote the Products and Services for the equipment the dealership sells and services. To successfully accomplish this there are two types of marketing utilized:

  • Product Marketing- focuses on a specific product, features/benefits, comparing one product to another, product application. 
  • Services MarketingUtilizes marketing strategies that apply customer-centric approaches, builds trust with the customers, and how the dealer’s services can support the customer and the products that were purchased. The offerings will often include benefits, promises, commitments in savings, safety improvements, turn time commitments, and firm pricing. All of which are focused on building trust and relationships.

The remainder of the article will focus on the history and application of Services Marketing.

A Brief Timeline of Key Developments in the History of Services Marketing 

  • 1950s-1960s:  The Services Sector arises as the economies shift from manufacturing to service-oriented markets.
  • 1970s: The 4Ps of marketing were expanded to include People, Physical Evidence, and Processes.
  • 1980s: Growth of Services Marketing Literature grew to academic research and focus services marketing, which included an emphasis on service quality and customer satisfaction.
  • 1990s:  Digital transformation and customer experience evolved due to the internet and digital technologies/
  • 21st Century:  Services marketing continues to advance with the inclusion of data analytics and artificial intelligence with a focus on improving interactions and personalizing of the customer experience.

The formation of Services Marketing has focused on the challenges and addressing opportunities within a unique market.

Apply Services Marketing in the Heavy Equipment Dealers Business Model

Services Marketing applied in the heavy equipment dealer’s business model will contribute to the enhancement of customer satisfaction, customer loyalty, revenue growth, and introduction of new product support offerings.


Strategies to Effectively Implement Services Marketing within the Dealers Territory

    • Identify and Understand the Customers’ Needs:
      • Understand the specific needs and preferences of the customers within specific markets. For example, in many cases the needs of the small fleet owner will be different than a large fleet owner, or governmental agencies.
      • Identify the challenges faced by the customers, including frequency and severity of the application.
  • Segmenting and Targeting of the Market:
      • Segment the market based on factors such as fleet size, industry, type/size of machines, local work environments (weather, altitude, job site restrictions)
      • Identify how tailoring the services can assist in meeting the needs of each segment.
    • Develop Value-Added Services:
      • Offer value-added services such as equipment maintenance, machine inspections, mobile air conditioning repairs, field machining services, extended warranties, hydraulic component rebuilds, machine second life rebuild options.
      • Operator and equipment maintenance/repair training for customers.
      • Proactive services connecting machine GPS data to schedule PM services, notifications of machine alerts such as overheats and over speed occurrences focused on preventing down time, improving utilization, and extended the life of the components of the machine while providing touch points with the customer.
    • Communication of the dealer offerings:
      • Clearly communicate the value-added service offering that includes additional benefits and features based on the needs of the customer. These needs would have been collected through customer surveys, focus groups, historical customer response surveys.
      • Utilizing various channels to communicate the offerings through online platforms, brochures, Product Support, Sales Representatives, and Parts Counter Sales personnel are a few examples of communicating the offer to the customer.
    • Build a strong online presence:
      • Establish and continually review and update the user-friendly website.
      • Utilize social media platforms, customer events, community events, local industry trade events that will provide an opportunity to share customer success stories and provide insight to the dealer’s approach of addressing customers business needs.
    • Customer Education and Training:
      • Offer training programs for customers that provide an opportunity to expose and familiarize the customers with the features and benefits of the services provided.
      • Provide educational content, reference materials, and tutorials that empower the customers and enhance their skills.
    • Responsive Customer Support:
      • Implement a responsive customer service process that addresses questions and concerns quickly.
      • Offer multiple channels of communication, including phone, email, and live chat. Quick and accurate responses are important.
      • Utilize the information received to modify and improve the messaging of the services offered.
    • Services Guarantees:
      • Provide service guarantees such as quick response times for maintenance requests, warranty offerings, firm pricing, timely invoicing.
      • Clearly outline the terms and conditions of the service guarantees to avoid confusion both with the customer and within the dealership’s service areas, such as the service department and the warranty department.
  • Feeback Mechanism:
    • Establish a feedback process to gather insights from customers about their experiences with the new service offerings.
    • Utilize the feedback to continually improve and modify the service offerings.
  • Collaborate with the OEM:
    • Partnering with the OEM can enhance the service offerings through program support, technical and historical information of other dealers that may have implemented a similar service offering.
    • Leverage the OEM certifications to build trust and credibility to the dealer’s offering. Fluids Lab certification, Root Cause Failure Analysis Certification, Hydraulic Technician Specialist, Certified Equipment Training Instructors are examples of certifications that can add value to an offering.
  • Promotions and Loyalty Programs:
    • Promotional campaigns will highlight the new service offerings.
    • Implement or link to an existing loyalty program to encourage utilizing the new offering, reward repeat business, bundle with other offerings. All are intended to build long-term partnerships.
  • Networking and Industry Involvement:
    • Participate in industry events, trade shows, and associations to stay updated on industry trends and build a network of contacts.
    • Collaborate with other businesses in the heavy equipment industry to expand the service offerings. An example would expand the hose and fitting business from the customer’s machines to re-hosing of garbage truck fleets as an expanded service offering within the waste/landfill customer base.

The above strategies can effectively assist the dealer apply the services marketing principles to create a competitive advantage and build long-term relationships with the customers.

Closing Remarks

While both services marketing and product marketing share common marketing principles, the unique characteristics of the dealer’s services offerings require different strategies and approaches to meet the marketing needs of the various customers.

Services marketing emphasizes the crucial elements such as customer-centric, variability (among customers), intangible (the tractor business is a people business), relationship building and delivery of exceptional customer experiences.

Did you enjoy this blog? Read more great blog posts here.
For our course lists, please click here.

Utilization of Business Tools: Understanding and Growing the Dealer’s Hydraulic Business

Utilization of Business Tools: Understanding and Growing the Dealer’s Hydraulic Business

Guest writer Ron Wilson continues his study of the hydraulics side of our industry in this week’s guest blog, “Utilization of Business Tools: Understanding and Growing the Dealer’s Hydraulic Business.”

Customer and industry surveys can play a significant role in identifying and developing growth opportunities in the product support business. The following is an example of how survey information can help shape the hydraulic rebuild/repair business within a dealership.


Three examples of survey information:

  • Industry studies & research
  • Study the local market to evaluate the current state by using customer input.
  • Dive into the historical parts & service sales activities to support finding and identify new opportunities.


Industry Studies and Research


There are many professional trade associations that conduct ongoing studies. An example relating to the hydraulic industry is the information from National Fluid Power Association (NFPA) https://nfpahub.com/stats/market-trends/. This organization provides some free information from their website, and a deeper dive can be obtained through membership status. For example, the information below provides the dollar volume trend in fluid power shipments over the past several years. A deeper dive into more specific hydraulic markets is available from the website such as mobile hydraulic components.

Studying the Local Market


Comparing the local market to the national market brings a clearer view of the opportunities and areas to focus on to obtain a deeper understanding of the potential.


Designing the Survey of the Local Market is an important starting point.


The initial questions of why we are doing the study and what is the intent of the outcome.


  • Objective- Define the objective of the survey:
    •  Are we gathering feedback on existing programs/services?
    • Identifying new offerings opportunities
    • Identifying areas for improving current programs/services


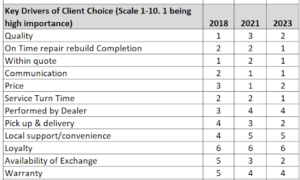
Below is an example of the customer responses from three surveys conducted between 2018-2023. This allows us to determine changes in the market and customer expectations:


  • Ranking 1 & 2 shows the area of high importance to the customer, while 5 & 6 shows the less important. The scale was in a range of 1-10 (1 being of most importance).
  • Changes in the market can be seen in Pick Up & Delivery and Availability of Exchange. Both areas have become of higher importance over the three surveys, while Warranty, Loyalty, Local Support/Convenience, and Performed by Dealer being of less importance.
  • Without the survey we may have selected focus areas that can be costly and not as important to the customer and overlook areas that are of importance to the customer.

  • Develop the structure of the questions. 

Are we trying to identify the: 

  • Satisfaction with current services 
  • Areas needing improvement.
  • Additional services to be added to current offerings. 
  • Overall experience and suggestions with our company and with competitors


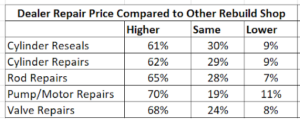
The information below provides examples comparing rebuild quality and pricing of the common hydraulic components. A key element shown below is the customers feel the rebuild quality is about the same as the competitors, but the pricing is considerably higher.

The above information can lead to discussions and modifications to address these two critical areas of quality of rebuilds and pricing.


Utilizing multiple channels to obtain survey responses can provide a broader reach of responses. 


A combination of the following can provide a broader view, but requires a little more management of the information going out to the customer and coming back in: 


  • Email (SurveyMonkey is a great tool with some limitations based on subscription level)
  • Website/social media
  • One on One visits and interviews (focus groups can be useful in this space as well)
  • Internal data showing data points from an historical view.


Analyzing and leveraging the results of the survey is really the important part of effort. We are looking to: 


  • Identify trends.
  • Segment results 
  • Prioritize Opportunities and Timelines.

The example below identifies the rebuild seal kits that have been purchased over the counter by customers, which can help identify rebuild opportunities for the dealer’s hydraulic shop. For example, a continued growth in the sales of part number A1000 may provide an opportunity to provide exchange lean cylinder for motor graders, or a rebuild program with a firm rebuild price.

The results of the questions below show the customer’s preferred pricing method. In this case Firm Quote is the preferred pricing method in all examples. If our shop only provides Time & Material pricing and our competitors provide Firm Quote, we will most likely gain business by changing our pricing strategy.

The example below shows the level of interest the customers have in utilizing the dealer’s exchange offerings, and the internal use of dealer exchange by the Service Department. 

The question below relating to Warranty Coverage may be a surprise. Usually, we think of longer warranties as a sales tool/incentive, but in some cases longer warranties may not be a key driver in growing the business. In the case below 180 days warranty is the most preferred by a wide margin. Anything below and over 180 days may not provide as much perceived value based on the customer’s input.

Implement Change based on the results of the survey information will take some time and focus:

  • Translate survey finding into actionable insights will involve:
    • Sharing the survey results with the various internal stakeholders such as:
      • Parts Department
      • Service Department
      • Product Support Sales Representatives 
      • Leadership team
    • Action plans and timelines are critical at this point. It may not be possible to implement everything at once but start with a critical few and roll the other items out within a defined time.
  • Communicate the survey results to the customers sharing the changes/improvements being implemented based on their feedback. 

Hopefully the above example shows how the use of external information, local market analysis, customer surveys, along internal historical data can provide direction, focus, and information to grow and manage your product support business.

Disclaimer- The data shown are not actual results, but modified results of an actual study.


Did you enjoy this blog? Read more great blog posts here.
For our course lists, please click here.

The Four “R’s” Within a Talent Management Strategy

The Four “R’s” Within a Talent Management Strategy

Guest writer Ron Wilson writes about one of the critical focus points of a business plan: the employees. Here he shares “The Four ‘Rs’ Within a Talent Management Strategy.”

Many years ago, we were developing business plans for the year and one of the critical areas of focus was Employee Retention and Recruitment. Retention and recruitment have been a challenge throughout our leadership roles, regardless of the department we lead, or the industry we are a participant in.

Within Employee Retention and Recruitment there are four areas of focus:

  • Recruitment
  • Retention
  • Relationships
  • Respect

Focusing on the four areas above will improve employee retention and attract the new talent needed for the future.

Recruitment– This “R” focuses on recruitment of talent from outside the organization. Recruiting to fill the immediate and long term needs for skilled talent in our industry will continue to be an obstacle to business growth potential. Therefore, out of the box creative approaches are necessary to recruit talent.

  • Recruitment of talent from outside the organization should include a variety of approaches. There is no one successful approach in finding skilled talent and it’s important to continually evaluate what is working and seeking innovative approaches. Look at what other companies are doing (inside and outside the industry).
  • Advertisements will take a focus on what the organization has to offer as a career and a long-term employer with very competitive wages and benefits, seeking employees that will take the company into the future. 
  • Special events utilized to identify skilled talent. Some examples are rodeos, racecar and motor cross events, trade shows, and vocational schools. The intent is to reach communities where potential employees live their daily lives outside of work.
  • Apprenticeship programs will be utilized to “grow” the needed talent from within and outside the organization. Participating in community college and high school technical skills education provides a wonderful opportunity to expose the company to individuals that are seeking a company that is not only a place to work, but also build a career.
  • Shorten the time between posting a position and providing a job offer. Individuals applying for a position are ready to move forward with a new opportunity, and most likely are applying for several positions at other companies. Let’s not delay in reviewing the applications, scheduling interviews, and providing job offers. Develop a metric to measure the amount of time it takes to hire a new employee. It may be surprising the amount of time it takes to recruit, interview, and hire someone,
  • If the applicant does not match the needs of the position being applied for, is there a role that may be a better fit within your organization? 

Retention– This “R” places a great deal of emphasis on developing the talent within the organization to meet the immediate and long-term skill set needed to take the organization into the future. 

  • Development of internal talent will include the skill sets for technicians and non-technicians. 
    • The priority will include developing the skills in the basic skills needed to accomplish the individual’s current job responsibility.
    • Skills needed to prepare the employee for the next level in their career path. 
    • There should be a “building block” approach with career path options. For example, technical level 1-4 starts with the basic skill set needs of a technician to advanced troubleshooting and diagnostics. Additional advanced levels for a technician can include Technical Communicators, Service Department Supervisors/Managers, Product Support Sales Representatives, and Training Instructors. 

Respect for dealing with each other leads us through the challenges that will occur. There will not always be an agreement in everything we do, but everything we do can be managed in a manner of respect. The issues should be addressed based on the issue, and not on the person. 

Relationships that are positive between employees encourage an environment that allows growth and development as individuals and as teams. 

  • Through positive relationships the organization will recognize the needs of the marketplace and introduce competitive products and services that add value to our customers. 
  • Strong internal relationships encourage strong relationships with our customers.
  • Recognition is important to all of us. It is important we seek the opportunities to recognize individuals and teams of employees on their successes and contributions to the organization. Each supervisor should develop their own way of providing employee recognition for their areas of responsibilities. The types of recognition will vary based on the event, the location, and the employees.

The Four “R’s” play a significant role within our talent management strategy of taking care of the current employees and seeking the employees needed for the future.

Did you enjoy this blog? Read more great blog posts here.
For our course lists, please click here.

Utilizing a Personalized Employee Benefit Statement as Part of the Employee Retention Plan

Utilizing a Personalized Employee Benefit Statement as Part of the Employee Retention Plan

Guest writer Ron Wilson offers insight into employee benefits tonight in, “Utilizing a Personalized Employee Benefit Statement as Part of the Employee Retention Plan.”

Employee retention plans have become an important part of the organization’s overall recruitment process. As we know the cost to recruit, hire, and train a new employee can exceed the cost of investing in the current employee, especially when we include the revenue lost while we are trying to fill the position.

Although effective Retention Plans have many elements, it is worth our time to focus on one specific element, a Personalized Employee Benefit Statement. Below is an example of how a Personalized Employee Benefit Statement was utilized in retaining a key employee.

A highly productive Product Support Sales Representative scheduled a meeting with me and during the meeting he presented a letter of resignation. We spent some time reviewing the reasons for wanting to leave the company, where he was going, and reemphasizing the importance of his role within our organization. As we were wrapping up our discussion, I gave the letter of resignation back to the employee explaining that I would not accept the resignation at this time and asked that he compare the benefits his “new” employer would be providing as to what he was currently receiving. 

 We would review what he found out the following day and at that point if he still wanted to resign, I would accept his letter of resignation.

Later that evening the employee called me and asked if he could withdraw his letter of resignation. During his review of the “new” employer’s benefits, he discovered their medical coverage was insufficient to what he was currently receiving and his accrued time off was far less than what he was currently receiving.

The Personalized Employee Benefit Statement played a key role in the retention of this key employee. There was work to be done to address some other issues, but we now had some time and an open dialogue to continue strengthening our relationship.

Content of a Personalized Employee Benefit Statement

There can be many elements within a Personalized Employee Benefit Statement, but we will review only a few:

    • Employee Information- Name, employee number, years of service, job title
    • Company Information- Vision, Mission, Values
    • Salary Information- Including base salary, bonus, commissions, overtime.
    • Benefits Summary- This is the most important piece of the statement. Most employees do not see, and may not fully understand, some of these benefits and the cost.
      • Health Insurance- including premiums, deductible, and coverage, along with Wellness programs that are available. (Dental, vision, prescription drugs, etc.)
      • Retirement Benefits/Stock Options- This would include 401(k) match and other retirement plan information.
  • Life insurance and Disability insurance coverage
    • Paid time off (vacation, sick days, holidays)
  • Tuition Reimbursement and Training that has been provided to the employee.

There is no doubt many other examples you can recommend be added to a personalized employee benefits statement based on your organization’s information.

There were two key elements that contributed to the employee deciding not to resign. The medical insurance coverage provided by the new employer was insufficient due to some family medical needs and the new employer’s time off was insufficient to what the employee was accustomed to receiving.

The ability to quickly access this information and spend time with the employee to ensure their understanding of what is included within the current plan, what they may be giving up provided an environment of transparency and building trust. 

This discussion may also identify areas the current employer may need to address as it relates to a competitive benefit package.

To effectively build a Personalized Benefit Statement requires:

  • Information pulled together from payroll, benefits, training, and other key databases to consolidate into an individual employee statement.
  • Supervisors and Human Resources personnel being comfortable discussing the information and listening to the employees as they identify the areas of most importance to them.
  • Provide the personalized employee benefit at least once a year and be accessible to address the immediate situations that arise.

What would you include in a Personalized Benefit Statement? Have you had similar situations and were able to retain an employee that was resigning?

Did you enjoy this blog? Read more great blog posts here.
For our course lists, please click here.

1% Increase in Income Equals 2.6% Reduction in Expenses

1% Increase in Income Equals 2.6% Reduction in Expenses

Guest writer Ron Wilson dives into the financial management scene with this week’s blog: 1% Increase in Income Equals 2.6% Reduction in Expenses. He even touches upon something Ron Slee mentions frequently: the downside of discounts.

During complicated economic times businesses tighten up on expenses, spending, and accounts receivable. 

Rafi Mohammed, in his book “The 1% Windfall” provides an additional effort that can assist in meeting the needed changes to the bottom line.

Basically, the concept revolves around increasing income by 1%, without increasing the cost of sales, or reducing direct expenses.

The example below shows that a 1% increase in sales (without impacting cost of sales or direct expense) equals a 2.6% reduction of direct expenses. Apply your organization/department gross profit and pretax percentage to see the impact it has on your own organization.

We have all been through the difficult experience of reducing direct expenses, and it can be very painful.

Here are a few examples that can help to make a positive impact on sales without adjusting the direct expenses areas.

Current Status of Discount Programs– often discount programs are provided to customers based on a request from a salesperson. No doubt the programs may have been needed at a specific point in time, but a review of discount programs may show discounts being given that are not providing the expected increase in sales. Often the OEM provides some type of shared discount program over a specific timeframe. It is important to verify customers’ discounts reflect the OEM’s current program. An OEM may discontinue a rebate program and the dealer may not have applied the same changes and unintentionally may be caring the full burden of the discount being provided to the customer.

Effectiveness of Discount Programs-Verify the discounts are providing the expected results, which is usually increased volume, or expanded use of other products and services within the dealership. If the discount program was not effective, a different approach may need to be reviewed with the sales representative.

Below is a handy website that shows the impact discounting has on gross profits.

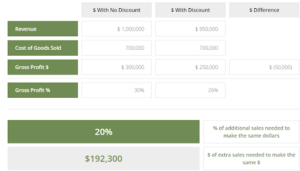
The example below applies to a 10% discount on $1 million in sales. Sales need to increase 20% to make up the same dollars.

https://www.growthforce.com/blog/how-giving-discounts-can-destroy-your-business-profits

This can be a great tool to share with the sales representatives when discussing providing a customer with a discount. What can be expected in increase volume over time?         

Providing Repair Options can offset the discount a customer is wanting on a component rebuild, for example. Rebuild options providing a “good-better-best” offering can accomplishing the customers rebuild needs within a specific price range. The variable rebuild options allows the dealer to rebuild a component that meets the level of rebuild needed by the customer within a selected price range. The repair options eliminate the “discount” of a full rebuild while providing a price based on the level of rebuild needed by the customer.

Value Based Pricing requires understanding the customers’ needs and priorities. For example, a customer is focused on reducing the hazards/injuries related to changing ground engaging tools (GET) on a piece of mining equipment. Promoting reduction of the number of GET changes will contribute to reducing the hazards as well as downtime to complete the GET change out. It may not always be about the dollars and cents.

When developing value statements your existing customers can be a great resource to find out what value you bring. Ask your customer to explain the real value of your offer. This will provide a view of their perspective, while building relationships with customers and at the same time it gives you a chance to learn an incredible amount of invaluable information.

Below is an example of a value statement that has identified four areas of importance to the customer. This information was taken from an ESCO GET (Ground Engaging Tool) promotional piece. As can be seen there is no discussion about “discounts,” the discussion is related to “value add” offerings:

Increased Machine Availability

  • Superior alloys and optimized system profile result in longer-lasting components
  • Simple, intuitive locks provide safer, faster parts replacement.
  • Reliability and wear life unmatched in the industry keeps machines operating with minimal downtime.

Lower Maintenance Costs

  • Proprietary alloy, increased lip protection and large bearing areas extend operating intervals.
  • Longer lasting and more dependable G.E.T. reduces planned and unplanned service events.
  • Quick and easy parts replacements by fewer crew members, with no hot work required.
  • Shrouds and adapters are engineered to protect more of the Nemisys lip leading edge, extending the service life between lip rebuilds by up to 70%
  • Improved wear metal placement increases shroud life by up to 30%

Lower Total Parts Expense

  • Longer lasting and more dependable G.E.T. results in fewer parts purchased versus competitors.
  • Fewer parts purchased reduces mine site inventory to ship, stock and manage.

Improved Safety

  • Keep your crew away from crusher maintenance through superior locking systems that keep teeth and shrouds on the lip.
  • Safer installation and removal with integrated pry points and compatibility with the ESCO SecureLift™ system

Best of Both Worlds

1% increase in Sales Without increasing Cost of Sales to Improve the Bottomline:  It would be unrealist to think the 1% increase model is the only option. No doubt there needs to be a combination of both direct expense management and reviewing the pricing models and programs currently in place. Below are some pros and cons that will show the importance of combining the two:

Advantages of the 1% Increase in Sales to Improve the Bottom Line:

  • Incremental growth may seem small but overall can have an enormous impact on the bottom line.
  • Growth in the business comes from income growth, not from reducing expenses.

Disadvantages of the 1% increase in Sales to improve the Bottom Line:

  • The 1% increase is not guaranteed and takes time to implement. Reviewing and developing impactful value statements takes time and resources to research, understand, and develop.
  • Takes time to implement, communicate, and evaluate the results of the changes implemented.

Reducing Direct Expenses to Improve the Bottomline:

  • Has an immediate impact depending on how drastic the effort?
  • May improve efficiencies through improvement/streamlining processes.
  • Requires a focus on the core business and focus on what is important.

The best Solution is a Blending of the Two:

Take some time to review the various recommendations provided in “The1% Windfall”, while reviewing the rest of your key performance indicators, to provide a balanced improvement to the overall financial results. 

Did you enjoy this blog? Read more great blog posts here.
For our course lists, please click here.

Machine Condition Monitoring Roles

Machine Condition Monitoring Roles 

Guest writer Ron Wilson writes this week’s blog on the topic of Machine Condition Monitoring Roles as part of a dealer’s product support offerings.

Over the past few years, we have been experiencing a new era emerge around machine condition monitoring.

  • OnStar was introduced in 1996 with a focus on a commitment to the “safety, security and peace of mind to its members”. (The evolution of Onstar- https://www.onstar.com/why-onstar/evolution-of-onstar-innovations)
  • Fluid analysis began sometime around the mid 1940’s with a focus on temperature, pressure and the occasional check for oil color and viscosity. (A History of Oil Analysis, Noria Media January 2023).
  • Payload monitoring has always been important but often was limited to the number of loads estimating the volume based on the bucket size. I remember my dad operating a wheel loader using two counters (one counting the number of trucks and one counting the number of loads).

For the most part dealers didn’t have a major need, or the ability, to apply condition monitoring within their dealership. Today condition monitoring is becoming a core piece of assisting the customers manage their fleet in areas such as:

  • Safety that can identify objects in the way of machine operation, operators being distracted, theft of a machine, locking out the use of machine.
  • Health of the machine and its internal components such as overheats, degree of wear/contaminates, condition of the various fluids, and fault codes indicating various potential issues ranging from life of a component to operator practices.
  • Production management in areas of payload, weight distribution, cycle times, fuel burn.

The equipment industry is moving from a Reactive & Preventive maintenance approach to Predictive and Proactive maintenance program at an extremely fast pace.

Many dealers have implemented roles and responsibilities around the areas of recording, analyzing, reporting, and recommendations based on the results from the various condition monitoring indicators. These roles provide valuable information to the customers and allow them to make decisions based on the data/information received with professional input and experience from the dealership and OEM.

Dealerships have begun integrating three primary roles within condition monitoring to support their customer base. The customers’ expectations will vary based on their own internal strengths and expertise, while utilizing the variety of information available from each machine and applied across their fleet.

The three roles that have emerged relating to the management, interpreting, and communication of the data/information relating to condition monitoring, in support the Product Support Sales Representatives are:


  • Condition Monitoring Specialist/Analyst- This role includes the collection and analysis of information relating to:
    • Equipment inspections
    • Work order/repair history
    • Fluid/vibration/thermography analysis and trends
    • Fault code information collected remotely, during machine inspections, and onsite data downloads.
    • Diagnostic test results
    • Predictive analysis-based baseline information and historical data
    • Preparing reports and summary information to be reviewed/reported to the customers
  • Equipment Management Consultant- This role may include tasks such as:
    • Equipment acquisition, disposal, and lifecycle management recommendations. Collaborating with the customer and dealer personnel to develop and maintain a comprehensive equipment lifecycle management strategy relating to rebuilds and replacement.
    • Maintenance planning includes preventive maintenance schedules, maintenance programs and procedures that optimize the utilization and reduce downtime.
    • Compliance and safety requirements are maintained, and all product updates are being addressed.
  • Equipment/Asset Manager takes the information relating to the two roles above while working with the Product Support Sales and Equipment Sales Representatives for the specific customer to develop an overall fleet plan through the lifecycle of the fleet.
  • Understanding the customers fleet planning strategy. Customers vary in their fleet replacement strategy relating to rebuilds/replacement schedules.
  • Overseeing the fleet maintenance and repair plans. Keep the maintenance schedule within the parameters developed in cooperation with the customer.
  • Monitor equipment performance compared to the established KPIs and provide early alerts the goals may not be accomplished and provide recommendations.
  • Monitor the customers rebuilds in the shop based on the agreed upon scope of work. Any variances should be identified and resolved with the various shops, the customer, and the Product Support Sales Representative.

The role of condition monitoring has come a long way from the early days described at the beginning of this article, and the roles are early in their development.

It will be important for the dealerships to keep abreast of the technology introduction of the future, how to apply the data/information in making decisions that not only support the dealership but also supports the customers fleet management expectations and developing the internal skills of the dealership relating to the ever-evolving condition monitoring and fleet management.

Did you enjoy this blog? Read more great blog posts here.
For our course lists, please click here.

Developing Your Personal and Employee Persona

Developing Your Personal and Employee Persona

Guest writer Ron Wilson explores the skills that we use in developing our personal and employee persona.

Over our work life a great deal of effort, education, time, and energy is spent on developing the “technical skills” relating to our careers. Technical skills relate to the technical part of any career. An accountant has technical skills relating to the specific role, just as an equipment technician has technical skills to perform repairs/rebuilds, troubleshooting and diagnostics of their career.

During our careers we develop a personal persona that is applied in our actions, roles, and responsibilities. As we progress through our career the types of information, skills, action needed changes and requires an ongoing balance of various skills development.

The skills needing to be developed can be placed into four areas:

  • Technical Skills
  • Personal Skills
  • People Skills
  • Operational Skills

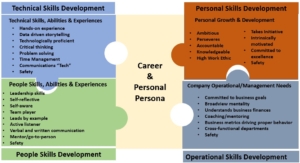
Below is a diagram that shows an example of an employee’s personal and career persona. It is important to balance the skills developed in each of the areas. During a visiting with a Human Resource team, we discussed the most common reasons employees are terminated, or resign, and in most cases, it is not due to a lack of technical skills. The cause is usually related to one of the other three categories.


The diagram above really shows the importance of balancing the skills development of our teams. Making sure training and development opportunities are provided in each of the areas, and time is spent with the employee discussing the strengths and opportunities that will provide continued growth relating to the overall personal development.

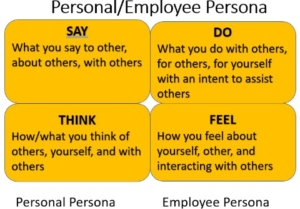
The diagram below shows that our “Personal Persona” is identified in what we “say and think.”  The “Employee Persona” is often seen in what do (our performance) and our relationships with others. In our everyday work we combine and exhibit all four areas.

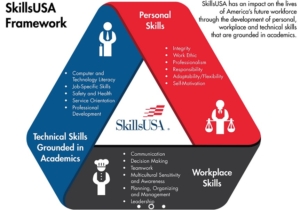
While serving on the board of directors at SkillsUSA Arizona I was introduced to the following diagram. I took this diagram and applied it to the equipment dealer work environment. SkillsUSA does an excellent job of developing the students’ work and persona to prepare them for future employment.

Did you enjoy this blog? Read more great blog posts here.
For our course lists, please click here.

Evaluating the Effectiveness of Training & Development

Evaluating the Effectiveness of Training & Development

Guest writer Ron Wilson explores using the Kirkpatrick method as a way of evaluating the effectiveness of training & development.

Within the dealership the owner, CFO, Training Manager, Department Manager, and Supervisors all ask if the training and development are effective and worth the time and investment being provided. Many articles, lectures, and books have been written on this very topic. The following are some examples that have been applied utilizing the “Four Levels of Training Evaluation” utilizing the Kirkpatrick model.

The Kirkpatrick Model includes the evaluations into the following areas:

  • Level 1 Reaction– How did the learning feel about the course, were they engaged, was the material relevant. This level can also be broken down to evaluate the course and the instructor.
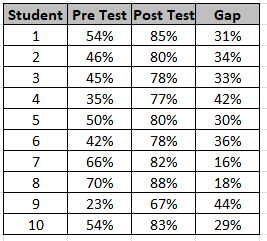
  • Level 2 Learning– This level measures the pre and post levels of knowledge utilizing a pre and post evaluation.
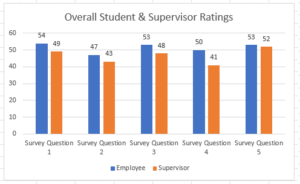
  • Level 3 Behavior– Utilizing a pre-determined time to evaluate from the student’s and the supervisor’s view the level the behaviors are being utilized in the employee’s role. Are the tasks from the training class being utilized in the workplace?
  • Level 4 Results– How has the training impacted the business? This can be a measure of customer satisfaction, amount of rework, reduced hours to rebuild a component.

Below are examples of how the information can be utilized and some comments on the implementation of the Kirkpatrick Model.

Reaction– This has also been called the “Smiley Face” survey. The survey is a recap of the student’s evaluation of the course material and the instructor. It is important to separate and review each individually.

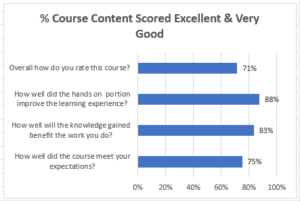
The information below shows the responses from twenty-nine students relating to the course content and firsthand experience provided in the identified class. % E & VG combines the Excellent and Very Good score percentages. The comments provide valuable input to be collected and utilized for future improvements.

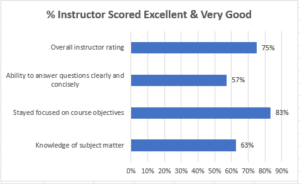
The information below shows a summary of the evaluation relating to the instructor leading the class and the comments provided. It is not uncommon to receive contradictory comments from a class. The class may have a wide variety of skill levels within the students attending the class.

Over time this information can be extremely helpful in evaluating the content and the individual instructors.

Learning- The level of learning obtained during the class provides a view of the knowledge level the student came into the class and a view of the knowledge the student is leaving the class. This is accomplished with a pre and post assessment. Below is an example:

Over time it can be determined that if a student came in with a low pre-test score the likelihood of not successfully completing the class. In this example 80% or higher is a passing score. The number of students passing, or not passing, the class can be a great tool for additional reviewing of content, instructor, and pre-requisites requirements.

Behavior– Level Three Evaluation reviews the application of the course material within the work environment based on input from the student and the supervisor. Utilizing a pre-determined time, the students and the supervisors evaluate if the behaviors are being utilized in the employee’s role. The evaluation is conducted by a survey of the students and the supervisors. These are specific tasks included in the class the student is expected to perform once returning to work.

Below is a list of tasks the student should be able to perform once returning to the shop area. The number of students and supervisors represents the ability of the students performing the tasks that was taught in the classroom. In this case there were more students that expressed their ability to perform the tasks as compared to the supervisors rating the employee’s performance of the task. Drilling down into the individual shops and supervisors, it can provide a little more detail of understanding the gap between the student’s score and their supervisor. Two items that may arise from the survey:

  • A student may be less confident in their ability to perform the task as compared to the supervisor. We see this when the supervisor score is higher than the student’s score.
  • The student may not have had the opportunity to perform the specific task since attending the class.

Results – The level of the results identified from attending the training class can be identified from expected business performance indicators such as:

  • Measure of customer satisfaction
  • Reduction of rework in the specific areas
  • Reduced number of hours to rebuild a component.

All four of the levels require an elevated level of communication between the operating departments, the Training Department, and the students.

A couple of key points on the implementation of the Kirkpatrick Training Evaluation Model:

  • There is a need for an LMS (Learning Management System) to record and analysis the information and data analysis skill set to establish the process, record, and report the results.
  • The typical Training Department may not be able to evaluate “all” of the classes being provided (can be a data overload in levels 3 & 4). Start small and expand over time.
  • This method can be utilized for all types of classes, soft skills as well as technical.

There are several resources to assist with understanding the model. James Kirkpatrick’s book “The Four Levels of Training Evaluation” is a great resource.

Did you enjoy this blog? Read more great blog posts here.
For our course lists, please click here.

Utilizing Three Key Sources of Information to Support the Product Support Business Growth

Utilizing Three Key Sources of Information to Support the Product Support Business Growth

Guest writer Ron Wilson covers the data points and information we can gather inside and outside the dealership in his blog post, “Utilizing Three Key Sources of Information to Support the Product Support Business Growth.”

There are many data points and sources of information within and outside the dealership that can support growing the product support business of a dealership. Two areas reviewed below are examples of a source within the dealership and one from outside of the dealership. 


Abandoned Shopping Cart Analysis


We have all left items in our online shopping cart. This is no different with the customers utilizing the online part lookup and order systems with the various dealers.


The abandoned parts orders can provide a wealth of information:

  • Model, serial and arrangement number. This information is not always provided and may not always be correct, but when provided tells a story in itself.
  • The parts list provides an idea of the type of repair that is needed. For example, a parts list to rebuild an engine is valuable information for Product Support Sale Representative to have during a visit with a client and understanding the customer’s rebuild direction.
  • A model, serial number, and parts list abandoned by a component rebuild competitor is one of the most important bits of information a salesperson can receive.


Maintaining the Dealership’s Machine Population List is a Challenge. 


Many dealers and OEMs utilize the dealer’s machine population within the territory to identify parts and service opportunity. It’s an ongoing challenge to keep the various customers machine population current. One suggestion is to monitor the various auction sites that your customers may use when disposing of machines. Some of these sites will list not only a photo of the machine, but also the model and serial number. Run this serial number against the dealer’s machine population list to identify if a client is planning to sell the unit at auction. Notify the Sales/Rental and Product Support Sales Representatives and update the machine population. 


Here are a couple of examples:

Both of the machines above came from an auction company’s website showing the location and detailed information about a specific machine.


Identifying Missed Component Rebuild Opportunities 


Very often a customer may source component rebuilds and parts purchases from various vendors in addition to the dealership. Reviewing the service repair history of a customer can help identify to what level the customer is utilizing the dealership’s total service capabilities. 


Depending on the dealer’s business system it may be possible to determine:

  • Does the customer utilize field service and shop service areas?
  • What components are being rebuilt (more important not being rebuilt by the dealer)? It is not unusual for a customer to rebuild engines themselves (or use a competitor rebuild shop), but always send the transmission rebuilds to the dealer for rebuild. Hydraulic cylinders are often sent to various competitors.
  • What type of repair/rebuild is being done by the dealership?
  • Depending on the OEM some part numbers are extremely specific to a component and often to a specific model of machine.


Utilizing the above information can be particularly useful when developing marketing campaigns, recording lost sales, and identifying future business opportunities. The dealership can apply a more focused approach for product support offerings.


There is a tremendous about of information available within the dealerships business system, the challenge is utilizing the data to understand the current environment and the future direction. Combining data analysis and business expertise can lead to increased part and service business, as well as improved customer service and support.

Did you enjoy this blog? Read more great blog posts here.
For our course lists, please click here.

Service Department Efficiency Gains through Repair Options

Service Department Efficiency Gains through Repair Options

Guest writer Ron Wilson continues his series with “Service Department Efficiency Gains Through Repair Options.”

Four-part series relating to Repair Options offerings:

  • Expand Product Support Offerings with Repair Options
  • Parts Department Efficiency Gains through Repair Options
  • Service Department Efficiency Gains through Repair Options
  • Who should Set Pricing for Repair Options Rebuilds?

This is the third in a four-part series relating to Expand Product Support Offerings with Repair Options.

The first article outlined the overall advantages Repair Options provides the customer and the dealership. The second article outlined how Parts Kits used in Repair Options can be a benefit to Parts Department of a dealership.

The Service Department can benefit from the utilization of Repair Options due mostly to efficiency gains in labor hours utilized in building a component.  The hours utilized in building a component include:

  • Prepping a component to be disassembled
  • Disassembling of the component
  • Inspection and preparing a quote to the customer (including parts, labor & misc.)
  • Waiting for the approval from the customer to go ahead with the quote provided
  • Ordering and returning of parts and cores
  • Assembly, test and adjust of the rebuilt component.

Based on the list above the key element is to reduce the number of labor hours relating to non-wrench time, while providing a quality rebuild within a specific timeframe.  Pauses during the rebuild process adds to inefficiencies, delays in completing the rebuild timely, and can contribute to quality issues.

Repair options addresses several of the above items by providing:

  • An agreed upon level of rebuild with the customer before the rebuild begins based on the defined Repair Options as discussed in the first article.  For example, the customer agrees to a Level 2 rebuild which includes Level one and subcomponents such as water pump/turbo/oil pump along with a detailed inspection and recommendations. The only need to gain additional approval from the customer is if an issue is identified that is outside of the defined scope.
  • Repair options will have a parts list already prepared and can be ordered using a “Paper Parts Kit” or a “Parts Kit”.  Review the previous article on Parts Kits and their purpose.  There is very little time needed to look up parts and the parts will be delivered to the shop bay in a manner to streamline the rebuild process.
  • Based on the parts kit developed using the 100% parts usage, the only parts to be returned will be the cores.

As can be seen using repair options can streamline the overall rebuild process. The customer pre-approved the level of rebuild, Parts Department has the parts kits delivered to the shop bay, and the technician focuses on the rebuild.

This is a Win-Win for the customer, the Parts and Service Departments, and for the overall dealership.

Did you enjoy this blog? Read more great blog posts here.
For our course lists, please click here.